
The truth is out there
Extracting Big Data insights to believe in
Did you know that eating chocolate during a diet leads to more weight loss? Did you know that striking powerful poses is good for your mental health? Did you know that drinking a few glasses of wine every week is healthier than not drinking any? It’s all true, I read it somewhere.
Today, statistics are everywhere—in the headlines, on viral TED videos, around the water cooler. And while fun to banter about with friends, all these pronouncements have fundamental flaws, some so egregious we should ignore them altogether. In fact, the biggest truth we can take from the statements above is that misinterpretation, often related to questionable statistical methods, occurs all too frequently with large datasets.
The problems with big data have boiled for decades in academia but recently have bubbled over into the popular press. Charges of “p-hacking” (most simply, selecting the data that gives you the correlation you want) and lack of reproducibility might lead some readers to think that you can’t trust any of the statistics you see in print. Carlos Dobkin, professor of economics at UC Santa Cruz, worries constantly about getting trapped by a finding that’s too good to be true. “This is my great fear—that I’m screwing it up in some way and don’t realize it. This is subtle stuff. You need to convince yourself that what you’re doing is correct.”
No mistakes
Dobkin has built a career as someone who does not make such mistakes, even with some of the thorniest of health issues, such as alcohol consumption or health insurance. He says a good analysis compares two groups that are identical to each other. Bad analyses find two groups and try to force them to be identical. For example, let’s say you want to prove that blondes are happier than brunettes. And let’s say you accessed a giant database that listed hair color and answers to survey questions on happiness. Sure enough, the lighter the hair, the happier the people were. All set, right? No, said Dobkin, you still haven’t answered the most important question. “Do I think that the brown-haired and blonde-haired people are identical in every dimension other than their hair color?” he said. “If the answer’s no, then you have to worry.”
For instance, brunettes would be much more racially diverse. People who dye their hair brown might do it for the same reason as those who bleach it, or they may not. Statisticians use accepted but often complex ways to control for these differences. Ultimately, however, the two groups simply aren’t the same and this limits the conclusions you can draw. To avoid this issue, Dobkin’s research often depends on something called discontinuity analyses, which split groups by a discrete cut-off point, such as turning a specific age, and then compares observations on either side to measure any change.
Take alcohol consumption. Almost since the national drinking age was set at 21 in 1984, policy makers have tried to lower it. Is this a good idea? Dobkin saw an opportunity to help answer this question because 20-year-olds are essentially identical to their 21-year-old selves. So, starting in 2003, he began collecting databases for hospital visits, arrest reports, death certificates, and surveys of people six months before and after their 21st birthdays.
This was no simple task. Dobkin had to find the data, convince state officials or private companies to let him see it, then make sure to collect it correctly. He made regular five-hour roundtrips to Sacramento to negotiate with officials and then to view the data. In the end, they put together a database of every arrest in California between 1979 and 2007—hundreds of thousands of arrests that occurred during that one crucial year of life.
“Carlos is the data whisperer,” said Christopher Carpenter, professor of economics and director of the Program in Public Policy Studies at Vanderbilt University and long-time Dobkin collaborator. “He can do mind-boggling things with those data—from 1979 to 2007, literally every single person who was arrested in the state of California.”
Data whispering
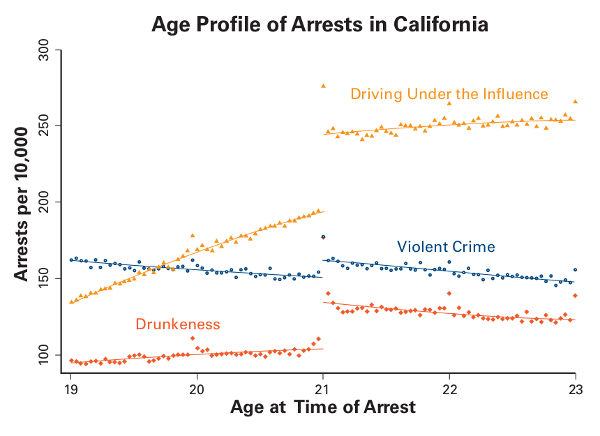
With this unique dataset in hand, Dobkin and colleagues performed their discontinuity analysis. The results were dramatic. Arrests, hospitalizations, and deaths all spiked with the onset of the legal minimum drinking age. He found people were 25 percent more likely to get a DUI and 9 percent more likely to die. Most of this was related to cars—either being caught driving under the influence or having an accident. In fact, you can chart the driving skills of every age group as they get more comfortable behind the wheel and their rate of deaths related to driving decreases. When they hit 21, as a group, they essentially lose two years of improvement and their numbers worsen to match those of 19-year-olds.
In some sense, this becomes the strongest argument for keeping the age limit where it is. Underage people will always try to sneak a few drinks or slip into a club, but these are outliers. Whatever the drinking age might be, it will be tied to increased hospitalization and death; the law just buys a few extra years while young people develop not just driving skills but maturity and ability to recognize risk. Becoming a worse driver at 21 is likely preferable to doing so at 18.
But 21 isn’t the only important age in our lifetime. We can drive at 16, join the military at 18, rent a car at 25. But how many of these ages offer opportunities to understand the effects of public policies on our lives? How about 65, the age at which Americans become eligible for Medicare? If you want to know how insurance affects health, age 65 is a good place to start. The problem is that you can’t just compare people with insurance to those without because they are not identical. “People who have insurance differ from people who don’t have insurance on many dimensions. For instance, they tend to have better jobs,” said Dobkin. “They can afford insurance, with all that entails.”
But people who don’t have insurance at 64 can get Medicare at 65. In 2009, Dobkin started digging into this and other questions and quickly confronted a whole new level of red tape. He would need to convince the state to let him look at public hospitalization records and then compare them to privately controlled credit reports, using social security numbers. But, for privacy reasons, he couldn’t see the social security numbers, so he had to get the two bureaucracies to coordinate in matching them. It took months of work, meetings, and endless hours in the car to Sacramento.
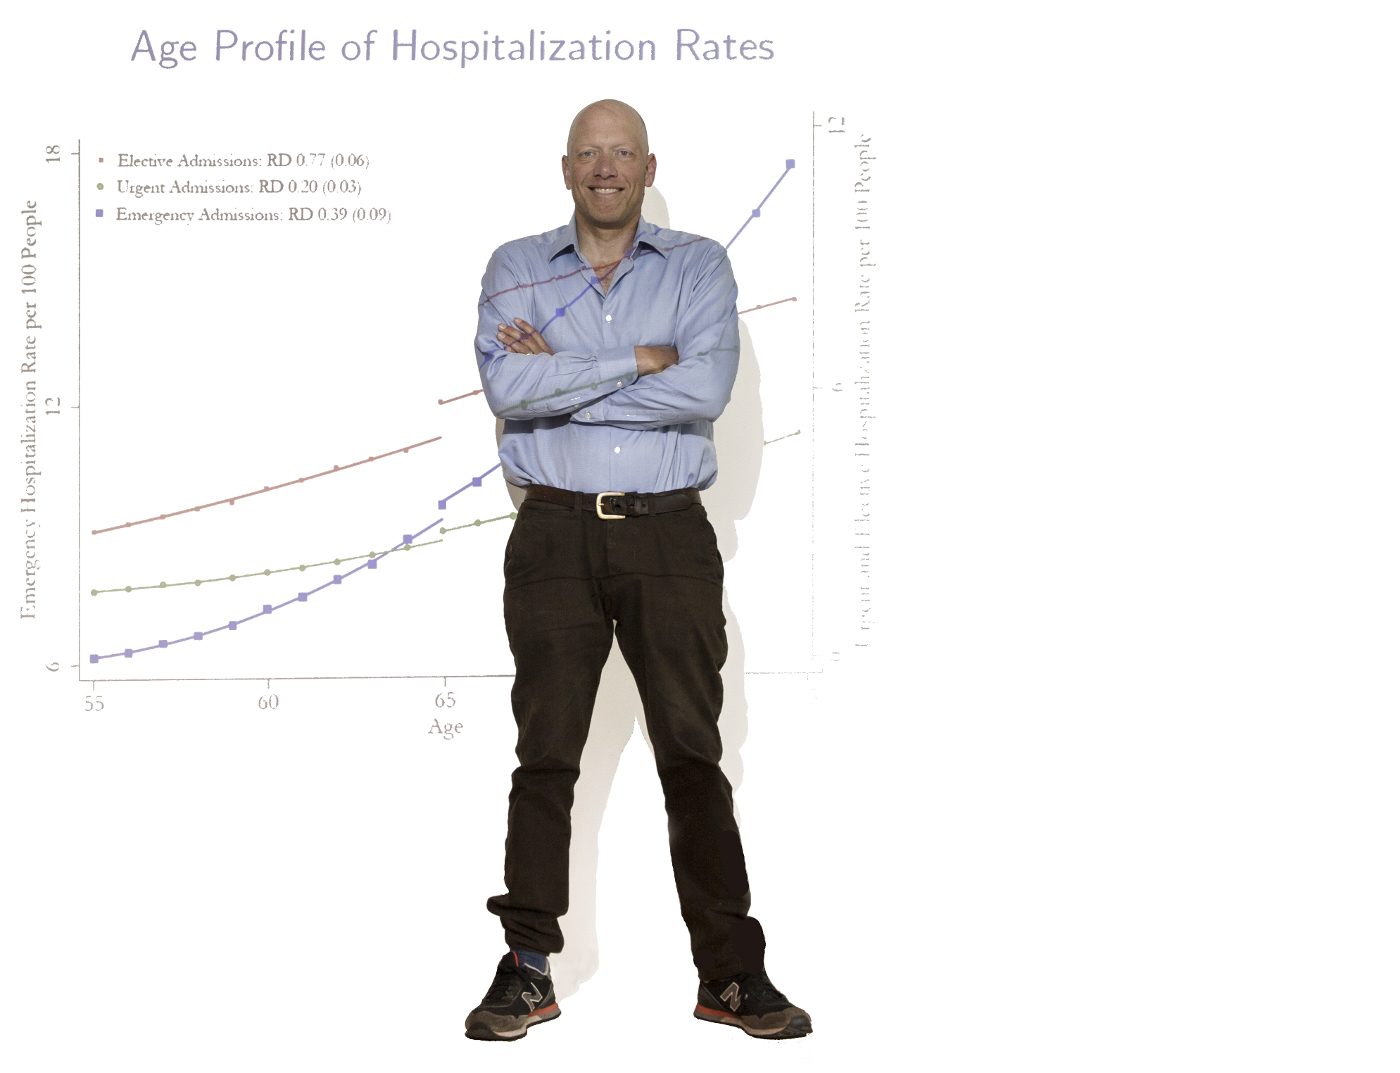
Health care unleashed
In the end, Dobkin built a dataset of 940,000 people around the age of 65 tracked at 10 different points in their lives. He found that having health insurance can radically change a person’s life. Before the Affordable Care Act (ACA), 10 percent of people just under 65 were uninsured. As soon as they had Medicare, their doctor visits doubled as people went in for procedures that they had been putting off. Knee and hip surgeries, cataracts, cardiac procedures, and colonoscopies all spiked. “The effects were almost too big to believe,” he said. “There was an enormous amount of unmet need in this 10 percent of the population.”
Today, with the ACA, the number of uninsured is less than half what it was but there is still a huge number of people suffering and just waiting for the 65-year clock to turn over. And it’s not just the uninsured, many people with poor insurance are also waiting until their 65th birthdays to go to the doctor. Dobkin’s work also found that—contrary to the popular belief that people without insurance use emergency rooms like a doctor’s visit—the uninsured are actually less likely to seek treatment in an ER. Michael Anderson, associate professor of agricultural and resource economics at UC Berkeley and another Dobkin collaborator, summed it up simply: “People are very price sensitive in their consumption of health care.”
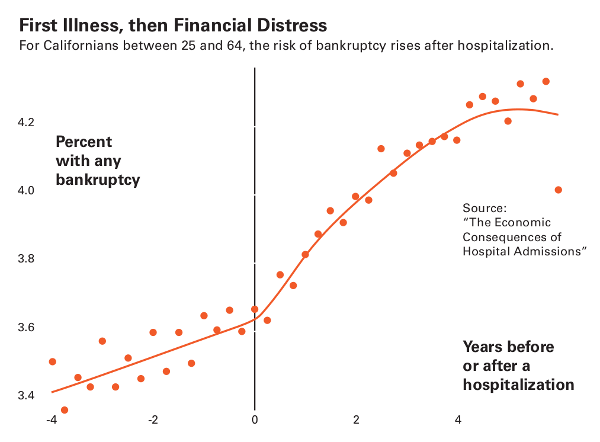
Another outcome linked to having no health insurance is bankruptcy. Elizabeth Warren, Massachusetts senator and 2020 presidential candidate, wrote about this phenomenon when she was a professor at Harvard, noting that half of people declaring bankruptcy had medical debt. But while medical bills may wreck your personal finances, do they really drive bankruptcy?
Again, Dobkin saw an opportunity. But this time, rather than using a specific age as the threshold, he used hospitalization and looked at people’s finances before and after. While Warren had looked at people who went bankrupt and worked backwards, Dobkin looked at people who were hospitalized and then evaluated how that affected their finances.
His findings were like Warren’s in some respects—medical debt is certainly crippling—but also different in key ways. For one, his bankruptcy numbers were lower. When you tracked forward, medical bills factored in only 5–10 percent of bankruptcies. And Dobkin’s work suggests that it’s not only the medical bills that break people, it’s also the time away from work. Not having health insurance does put you at higher risk, but it’s not the only driver, he said. “The real issue is the unemployment that results.”
This might seem like splitting hairs to most of us, but it’s important to policy makers. If medical debt is the primary problem, then we should be looking for ways to help pay people’s hospital bills. But if it’s a matter of income loss, we might do better by seeking to broaden medical leave insurance.
Fitting questions
Of course, Dobkin’s careful attention to methods and process is somewhat limiting. One criticism of discontinuity analysis is that it only applies to a few big moments in a person’s life. In other words, it forces you to look at questions that fit rather than ones that might address other important issues.
But in this era of unending dubious statistics, Dobkin said, it’s too easy to see whatever you want to in big datasets. We know that mercury is bad for you because its toxic effects occur quickly. In contrast, fat, sugar, coffee, alcohol, and even tobacco take a long time to trigger disease. Likewise, the benefits of pomegranate juice or tea tree oil just don’t pop up in straightforward analyses of even the largest datasets. “Most things don’t have big, immediately discernible effects,” Dobkin said. No matter how much we might want them to.