
Connecting the dots
Widely used by clinicians for decades, noninvasive neuroimaging techniques such as CT, MRI, and PET have also enabled neuroscientists to explore structural and functional networks, or “connectomes,” in the brain. Critical to this research are tools for effectively visualizing and interpreting the great mass of data generated by these imaging modalities.
A common task in studying neurological disorders such as Alzheimer’s disease involves comparing the connectomes of healthy and diseased groups to identify brain changes due to illness. However, no application existed that allowed robust comparisons in real-time of two or more connectome datasets.
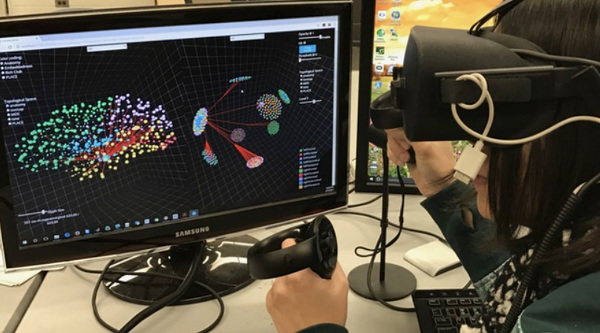
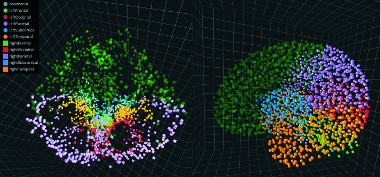
To address this need, UC Santa Cruz researchers, working with collaborators at the University of Illinois, Chicago, built the first system for 3D visualization of multiple connectome datasets via a synchronized side-by-side layout. Brain researchers and clinicians can access the system, NeuroCave, via a standard desktop environment or, for a more immersive experience, portable VR headsets.
“The ultimate goal is for a psychiatrist or neurologist to do precision medicine by using NeuroCave to compare a patient’s connectome with the average connectome for any number of diseases,” said Angus Forbes, assistant professor of computational media and senior author on the paper describing the tool.